Chaotic Harmonic Oscillator
Note: referenced paper is A simple chaotic oscillator for educational purposes, A Tamaševicˇius, G Mykolaitis, V Pyragas and K Pyragas
Read Final Presented Document: Sultan Almosbeh, Bachelors of Physics, CUE Paper
In my third and final year at Muhlenberg myself and a partner worked on our capstone project, to reimagine a chaotic harmonic oscillator via conventional parts through a physical electric circuit. Our circuit was a modified version of the initially presented one, with notable switch arrays isolating R2 (control variable) for protected resistance monitoring
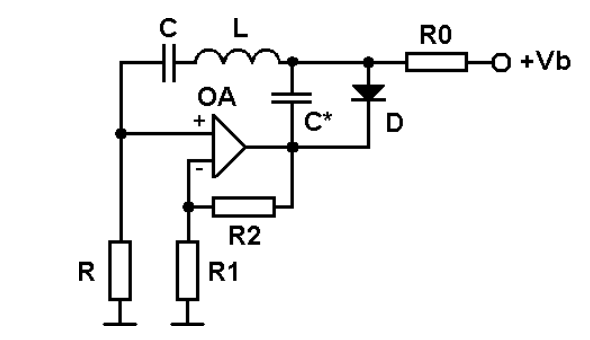
Circuit Diagram
An enormous hurdle was initially sourcing all the materials, as some tolerances were less sensitive than called for and decisions had to be made on my end regarding powering schemes for the Operational Amplifier (LM741). Interestingly, all parts were specifically noted to be easily sourceable and “off the shelf” components for most small-mid laboratoires.
Some requirements for chaos to be fulfilled are nonlinearity, which comes about from the 4184 diode as governed by the schottky diode equation (in which voltage increases contribute to exponential growths in current output) as well as three or more dynamical variables, and sensitivity to initial conditions. Detailed analysis of the interacting differential equations (and much more) is available within my research paper, but one of the
Pay attention to the two screens, the top is an oscilloscope and the bottom is a spectrum analyzer. These two devices were absolutely instrumental in determining chaotic vs stable regimes as the circuit itself doesn’t “do” anything to signal it is chaotic without outside instruments. The bottom analyzer shows current frequencies prevalent in the circuit whereas the oscilloscope shows voltage vs voltage. As the video progresses I am manipulating the control variable from O ohms to 10kOhms and we see some interesting behavior to note
Firstly, there is a spike early in the video where the fundamental frequency emerges; this is about 1.4khz
We see the oscilloscope display an oval signifying a stable regime, where a signal moves through the ciruit and ends where it started
We see another emergence of a frequency at f/2 (note the harmonics appearing at regular intervals, there is only 1 fundamental frequency and its divisions yet viewing the analyzer would lead you to believe there are many many present!)
Upon the emergence of f/2 we see the oscilloscope display a second oval, this is another stable regime and it signifies a period doubling. It will take much less adjustment of our R2 control parameter to see another doubling due to the nature of period doubling regimes
Viewing past the next few stable regimes we see explosions of data on both the spectrum analyzer and the oscilloscope, this signifies sudden rapid changes in the signals before and after amplification. See notes on both the spectrum analyzer and oscilloscope in the sub bullets
Oscilloscope : we see enormous activity and a notable lack of circular or ovular motion; this is due to the signals following one path, being reintroduced (via the feedback loops) and changing their path. This is why the oval appears to be “filled in” because randomness is forcing the voltage to enter new terriories.
Spectrum Analyzer: The signals explode into immense noise and blur the line between the fundamental frequency and its divisions. This signifies huge energy and impossible to determine behavior.
Overall my experience with this project was fully and completely positive, to try my hand at a more advanced project involving so many interacting components in the same circuit was much more interesting than deriving equations of behaviors for small single component circuits or bridge and filter design.
